Orange County 1Q 2026 Industrial Market Report
OVERVIEW
Two years into the correction cycle, the market showed its first clear signs of leveling off in Q1 2026. Vacancy expansion slowed, transaction velocity held firm, and the county recorded its first quarter of meaningful positive net absorption since early 2023. Demand is increasingly led by manufacturing. Precision fabricators, mechanical contractors, and defense tenants accounted for the majority of lease transactions, while traditional distribution users remained cautious and some segments continued to sublease excess capacity back to the market. Asking rents extended their correction from the cycle peak, though the pace of decline moderated. The construction pipeline contracted to its lowest level since early 2020, reducing forward supply risk. Heading into the second quarter, tempered stabilization, not rebound, defines the outlook.
VACANCY & AVAILABILITY
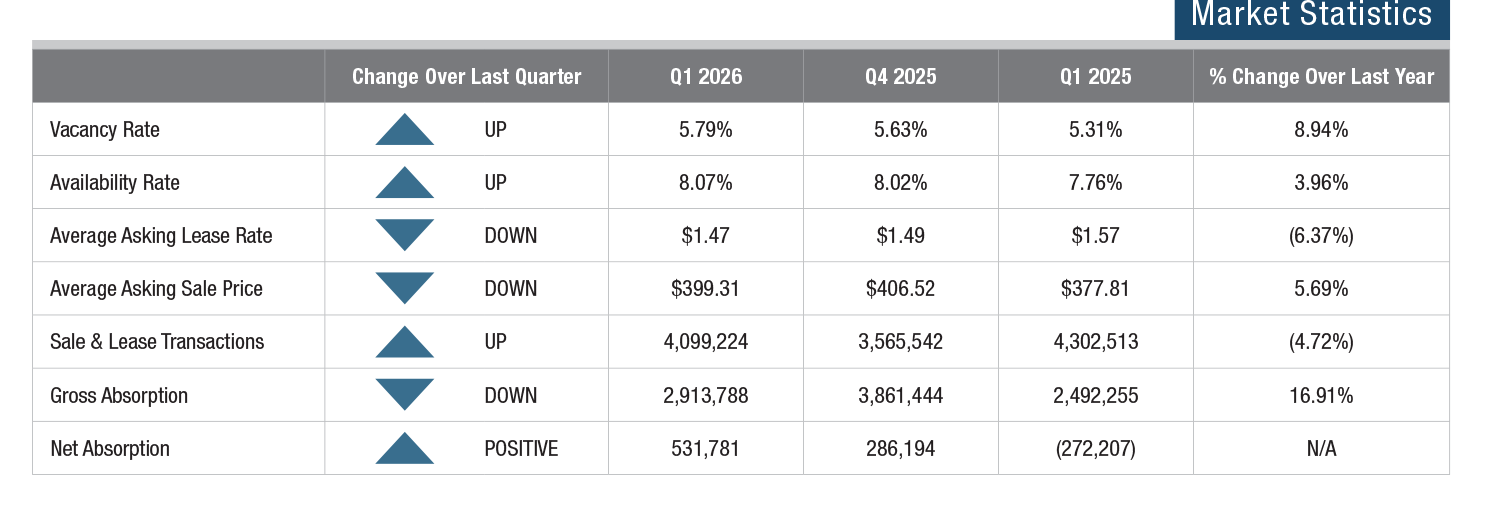
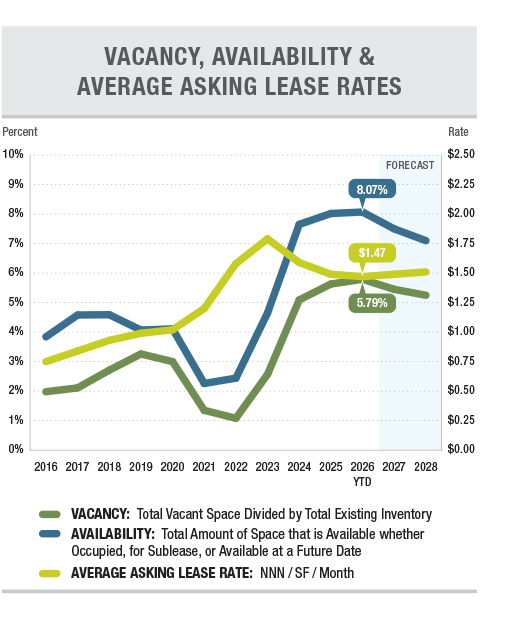
The industrial vacancy rate rose to 5.79% in Q1 2026, an increase of 16 basis points quarter over quarter from 5.63% in Q4 2025 and 48 basis points year over year from 5.31% in Q1 2025. Despite positive net absorption during the quarter, vacancy continued to climb as 712,208 SF of new construction were delivered. Vacancy stood at a cycle trough of 1.05% in Q3 2022; the pre-pandemic baseline in Q1 2019 was 3.32%. Total availability rose to 8.07%, slightly up from 8.02% in Q4 2025, and well above the 2.20% cycle trough in Q3 2022. The 228-basis-point gap between the 5.79% vacancy rate and the 8.07% availability rate reflects the persistent sublease inventory concentrated in the Irvine Spectrum and North County submarkets.
LEASE RATES & SALES PRICES
The average asking lease rate for industrial space declined to $1.47 PSF in Q1 2026, down 1.3% from $1.49 PSF in Q4 2025 and down 6.4% from $1.57 PSF one year ago. Asking rents have now declined 17.9% from the cycle peak of $1.79 PSF recorded in Q4 2023, a cumulative correction of $0.32 PSF over ten quarters. The gap between asking rates and net effective rents continues to reflect a competitive leasing environment. Lease activity was split between manufacturing-oriented facilities, which accounted for roughly 55% of transactions, and distribution product at 38%. The average asking sale price declined 1.8% quarter over quarter to $399.31 PSF, down from $406.52 PSF in Q4 2025, but rose 5.7% year over year from $377.81 PSF in Q1 2025. Sale pricing remains below the cycle peak of $438.89 PSF recorded in Q3 2022.
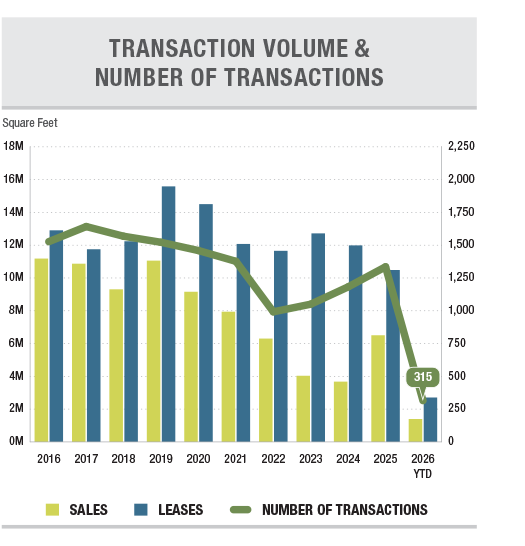
TRANSACTION ACTIVITY
Total transaction volume reached 4,099,224 SF across 315 deals in Q1 2026, up from 3,565,542 SF across 312 deals in Q4 2025. Leasing accounted for 278 transactions totaling 2,705,009 SF, with manufacturing and industrial services tenants representing the majority of deal activity. Investment sales included 37 transactions totaling 1,394,215 SF. The owner-user sales market continued to benefit from SBA 504 financing at 25-year fixed rates near 5.73%, with buyers across technology, food production, and bluecollar operations acquiring buildings as seller pricing expectations recalibrate.