

Orange County 1Q 2024 Industrial Market Report

OVERVIEW
 The Orange County industrial market took a step back in Q1. Net absorption ran well into negative territory and vacancy moved up. The number of sales declined by half, but lease transaction count improved. Active lease and sale requirements continued to decline and that led to a measurable decline in lease rates and sales prices that many have been expecting since the end of 2022. There were a couple of high-profile deliveries in the Airport Area submarket, but overall space under construction remains flat. Quality space offered for lease is still commanding premium rates, but it’s taking much longer to secure tenants. Landlords have responded by increasing tenant incentives. Owner / users sales are becoming more difficult to pencil due to higher mortgage rates, but there are still enough motivated buyers to forestall a major correction in sales prices. The SBA 504 mortgage rate was 6.28% as the quarter ended.
VACANCY & AVAILABILITY
Orange County’s industrial vacancy rate jumped 65 basis points to 3.22% in Q1 2024, up 176 basis points year over year. While still low historically, repeated increases signal a recalibration after more than a decade of supply-demand imbalance. However, limited supply, especially for sale properties, has prevented any significant price corrections. Owners reluctant to give up low 3–4% mortgage rates contribute to this trend. The availability rate, including occupied space for sale / lease, rose to 5.21%, maintaining a steady spread with vacancies. An expected surge in sublease space, another market correction indicator, has yet to materialize.
LEASE RATES & SALES PRICES
The average asking lease rate countywide fell by $0.09 in Q1 to finish the period at $1.70, but year over year, the county has seen a 5% increase in asking rents. The quarterly decline in rates could indicate the bull market in rent growth is over, at least for the short term, as higher vacancy, lower absorption, and slower transaction velocity have combined to keep rents under control. Sales pricing also took a step back in Q1. The average asking sales price fell by more than $15 per square foot to end the period at $410. Most sellers remain unwilling to lower prices to any significant degree, but buyers with more negotiating leverage are insisting on it to mitigate the higher cost of servicing debt. As a result, we are seeing a significant bid-to-ask gap for now.
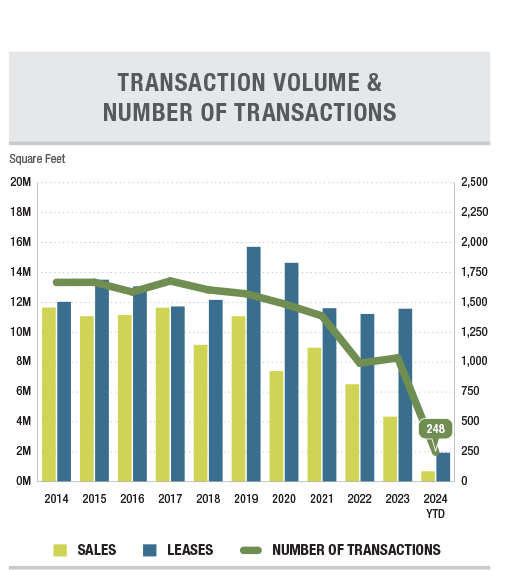
TRANSACTION ACTIVITY
Sale transaction velocity fell from 66 sales in Q4 of 2023 to 33 sales during the first quarter, in large part due to waning demand caused by persistently high mortgage rates. Additionally, the first quarter often reflects a seasonal component in the decline of transaction count, as many buyers and sellers are motivated to close by the end of a tax year. Owner / user sales have been the key driver in Orange County since the 1970’s, but high mortgage rates coupled with sellers reluctant to lower prices have thrown a wet blanket on owner / user sales since late 2022. Overall lease and sale activity by square footage fell by a third in Q1, ending the quarter at 2,641,212 SF, down from 3,753,159 SF in Q4. The decrease is all from sales, which dropped more than 50% by square footage, while lease square footage ticked slightly higher.


