Orange County 2Q 2023 Industrial Market Report
OVERVIEW.
 The Orange County industrial market stayed on its recent trajectory during the second quarter. Vacancy continued its move up and net absorption remained in negative territory, though gross absorption managed to increase. Construction fell slightly and remains at historically low levels countywide. Fewer active lease requirements have reduced overall market velocity and higher interest rates have sent many owner / user buyers to the sidelines. Surprisingly, average asking lease rates moved up again in Q2, but price reductions are becoming more common, as marketing time is now measured in months rather than weeks or days. But quality product, appropriately priced, is still moving quickly. Availability of buildings for sale remains very thin, and that has kept average asking sales prices in record territory, despite mortgage interest rates hovering above 6%.
VACANCY & AVAILABILITY.
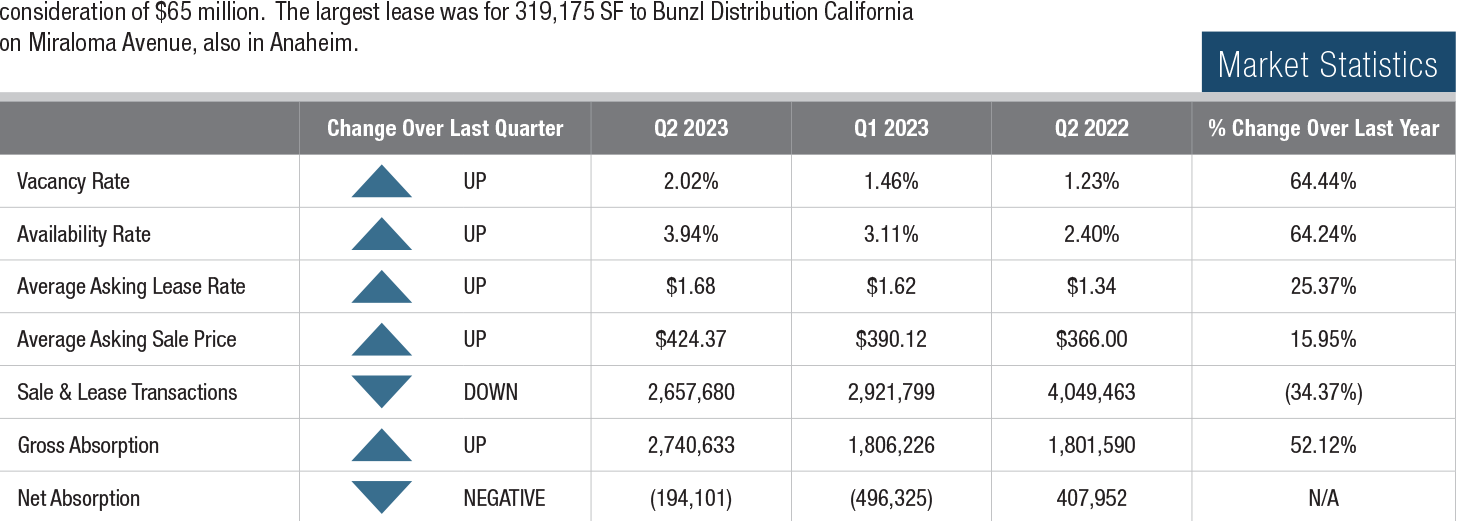
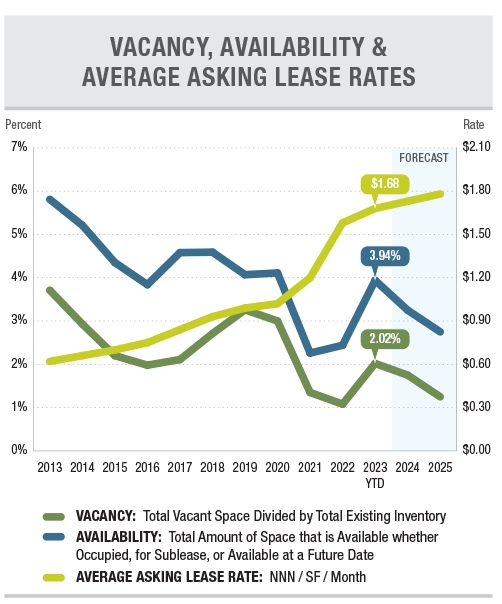
The vacancy rate in Orange County continued to rise in Q2,
reaching 2.02%, up 56 basis points from Q1. The availability rate, which includes occupied spaces listed for lease or sale, also increased, rising 83 basis points to 3.94%. This was primarily due to an increase in sublease space. Tenants have more options to choose from, so time on market is increasing. Landlords are prioritizing creditworthiness and lease term, as they anticipate a further softening in market conditions. They are more willing to offer free rent and tenant improvements to attract solid, long-term tenants. The lack of space offered for sale is helping to keep a lid on the rise in vacancy.
 LEASE RATES & SALES PRICES.

The average asking lease rate for the county keeps
moving up despite rising vacancy. That rate moved up another $0.06 per square foot in Q2 to $1.68 after a $0.04 increase in Q1. Year over year, asking rents have grown by 25%, despite the rise in vacancy and the slowdown in active requirements. The average asking sales price rose by
$34 per square foot in Q2, ending the quarter at $424.37, the highest on record. However, that big move up reflects more for-sale buildings in the smaller size ranges, which command a higher per-square-foot price. Elevated mortgage rates have reduced demand from owner / users, but with
so few buildings offered for sale, there is still enough demand to absorb every building that comes to market, allowing sellers to hold firm on pricing.
TRANSACTION ACTIVITY.
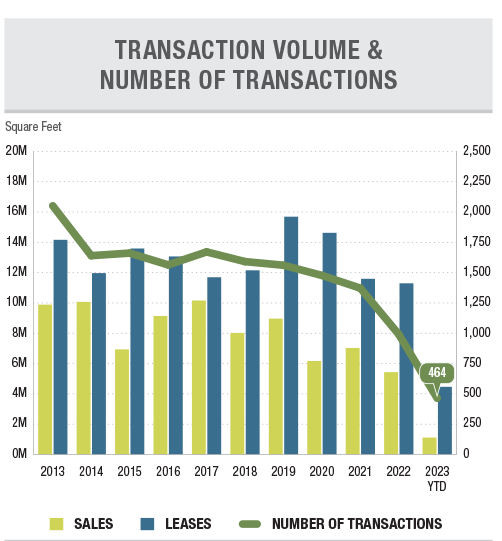
There was little movement in the lease and sale market in Q2. Despite rising vacancy, the supply of high quality, functional space remains low, as the bulk of existing space is older with elements of functional obsolescence. Fewer active requirements circulating in the market have reduced the competition for space, lowering the level of urgency for tenants and buyers to make quick decisions. The number of lease transactions increased to 209 in the period from 189 in Q1, but just 25 sales were recorded in Q2, down from 41 in the first quarter. Total lease and sale activity by square footage fell to 2.6 MSF from 2.9 MSF in Q2. However, year-over-year sale and lease activity is down by over 34% and time on market for space is on the rise. The biggest sale of the quarter was a 182,800 SF portfolio sale in Anaheim, with total consideration of $65 million. The largest lease was for 319,175 SF to Bunzl Distribution California on Miraloma Avenue, also in Anaheim.