Orange County 2Q 2025 Industrial Market Report

OVERVIEW
Orange County’s industrial market entered 2025 in a mode of cautious realignment. Activity continues, but both landlords and tenants are pausing to reassess amid shifting external pressures. Rising tariffs have disrupted supply chains and caused some occupiers to defer space needs until inventory and logistics stabilize. In addition, recent federal legislation has expanded Qualified Business Income deductions and revised Opportunity Zone rules. These tax changes are expected to bolster investor appetite but also introduce some uncertainty as implementation details settle. The result is a market defined by measured repositioning rather than bullish expansion. Users are strategic and deliberate. Owners are calibrating offers to sustain tenancy. The tone is disciplined, but not paused, as both sides adapt to a shifting policy landscape.
VACANCY & AVAILABILITY
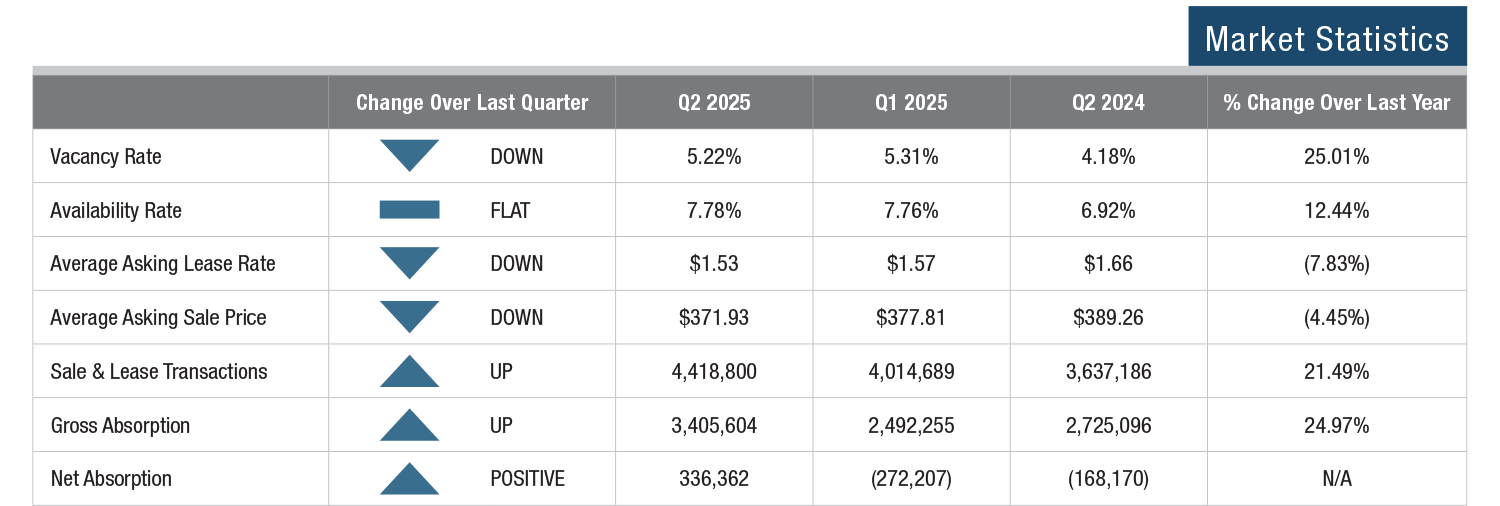
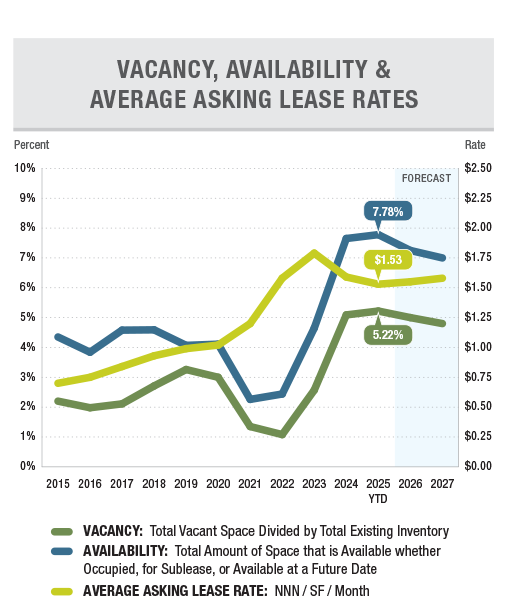
Orange County’s industrial vacancy rate dipped to 5.22% in Q2, down slightly from last quarter but still up more than 25% year over year. Availability held flat at 7.78%, showing a steady pipeline of options despite slower decision-making. Much of the vacancy remains in larger, newly delivered buildings without preleasing. Airport Area closed Q2 at 5.68% vacancy, North County at 5.43%, South County at 3.66%, and West County at 4.94%. Landlords are focusing on tenant retention and targeted leasing strategies to keep occupancy stable, while tenants carefully weigh flexibility, costs, and long-term growth before committing to new deals.
LEASE RATES & SALES PRICES
Orange County’s average asking lease rate declined again in Q2, ending at $1.53, down from $1.57 in Q1 and $1.66 a year ago, a 7.83% annual decrease. Although some expected a more dramatic correction, the drop has been gradual. Effective rates, which include concessions like free rent and tenant improvements, are even lower, giving tenants added leverage in negotiations. By submarket, South County remains the highest at $1.72, followed by North County at $1.51, West County at $1.52, and Airport Area at $1.49, highlighting regional differences in pricing and demand. On the sales side, the average asking price fell to $371.93 per square foot in Q2 from $377.81 in the last quarter and $389.26 a year ago, a 4.45% annual decline. We should note the average asking lease and sales prices fluctuate from quarter to quarter due to the varying size of buildings on the market.
TRANSACTION ACTIVITY
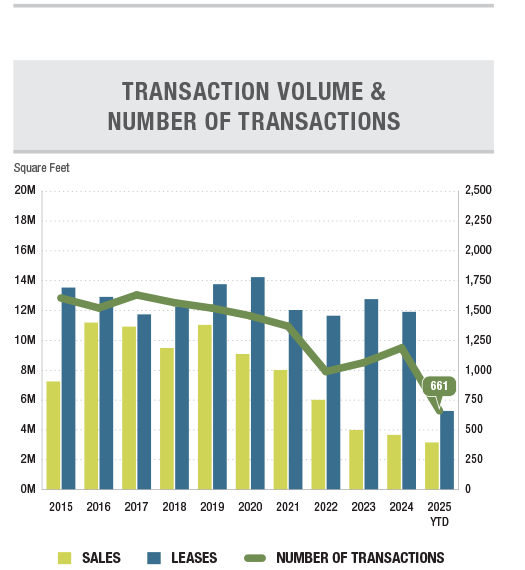
Transaction activity picked up in Q2 2025, totaling 340 combined lease and sale transactions, up from 321 in Q1. Overall square footage transacted increased to 4,418,800 SF from 4,014,689 last quarter. Leasing accounted for most of the activity, with 282 deals totaling 2,925,938 SF, compared with 268 deals and 2,345,804 SF in Q1. Sales activity included 58 transactions, covering 1,492,862 SF, up from 53 transactions and 1,68,885 SF last quarter. This reflects cautious optimism as tenants and buyers continue to pursue high-quality, functional spaces despite higher interest rates and policy uncertainties. Tenants remain focused on flexibility and operational efficiency, taking more time to evaluate options. Landlords are prioritizing stable occupancy and targeted deal structures to maintain momentum in an environment that demands patience and adaptability.