Orange County 3Q 2022 Industrial Market Report
Overview
The Orange County industrial market was unchanged in many respects in Q3. Vacancy fell again, gross and net absorption were much the same, lease rates and sales prices moved up, construction activity was unchanged and transaction volume remained strong. However, the shortage of quality space persisted and OC business owners remain frustrated by the lack of options. As we indicated in our last report, there are anecdotal indications of waning demand and this could lead to reduced sale and lease activity. Mortgage interest rates have nearly doubled in the past year, making it more difficult to complete owner / user sales, a key component of Orange County’s industrial market. Persistent high inflation is wreaking havoc on profitability, and that has some tenants and buyers in a wait-and-see mode when it comes to committing to new transactions.
Vacancy/Availability
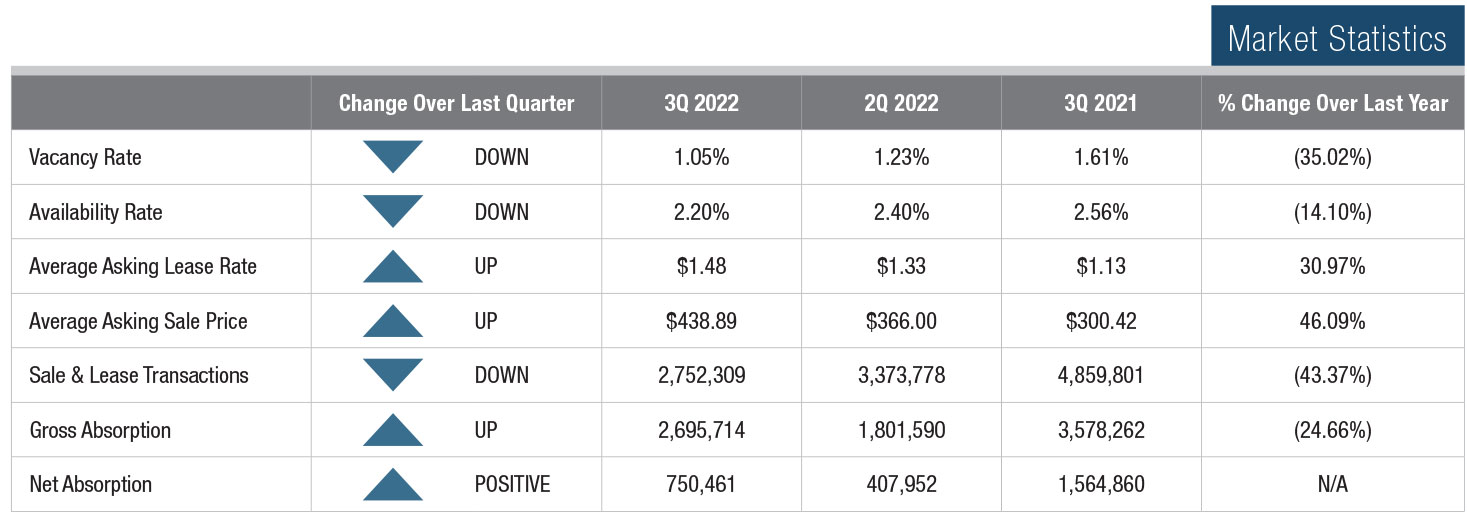
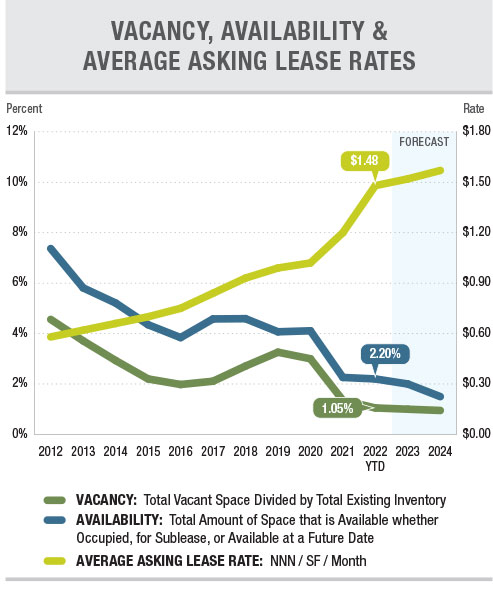
The overall vacancy rate in Orange County fell again in Q3 despite a perceived falloff in demand. Vacancy stood at just 1.05% when the quarter ended, down 18 basis points from Q2. But, as we have been reporting, many cities have vacancy rates
even lower than that. In fact, 18 of the Orange County cities we track have a vacancy rate well under 1%, including Anaheim, which has the largest inventory of industrial buildings at 44.3 MSF. The availability rate, which includes space offered for lease or sale but is still occupied, was 2.2% of the county’s inventory at the end of 3Q.
Lease Rates & Availability
The average asking lease rate for the county jumped another $0.15 to $1.48 in Q3, after a $0.09 increase in Q2. Year over year, asking rents have increased by 30.97%, but since many buildings have been marketed and leased without an asking rate, the actual average lease rate is even higher. Landlords are still holding the line on free rent and tenant improvement contributions. Fixed annual rental increases are also moving up. It is now common to see landlords insist on increases of 4% to 4.5% per year, rather than the traditional 3%.
The county’s average asking sales price is very difficult to interpret because price per square foot is heavily dependent on the size of the building. Industrial condominium pricing is over $500 per square foot in some areas, while larger buildings trade in the $350 to $450 per square foot range.
 The county’s average asking sales price broke the $300 PSF barrier for the first time in Q3, and then took a big leap of $23 PSF in Q4 to a record high of $323.14. Moreover, some smaller buildings with good amenities and location are trading in the $400 PSF range. Off-market deals are becoming more common as buyers are making aggressive unsolicited offers in the hope of securing a new building without having to face the intense competition associated with listed properties. Last quarter we characterized the sale market as being on fire and that is still the case.
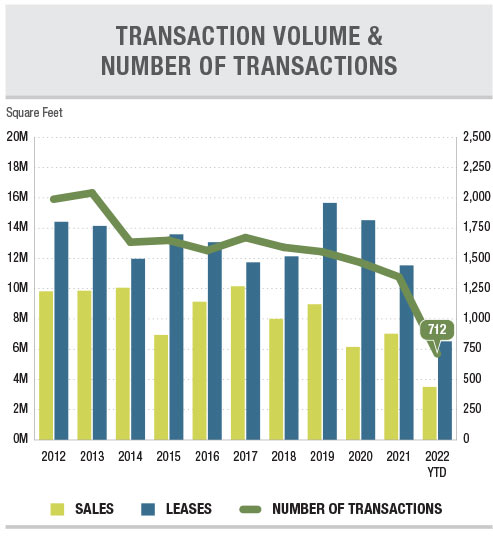
Transaction Activity
For the past several years, lease and sale activity has been restricted by the persistent shortage of quality space available. Many tenants and would-be buyers are left with no choice but to renew existing leases, even if their existing space no longer supports efficient operations. Many of those transactions don’t find their way into the quarterly statistics, so actual transaction activity is somewhat higher than reported. In the past several months mortgage rates have moved sharply higher and that is having an impact on owner / user buyers who utilize SBA loans to fund their purchases. The combination of record high prices and the rising cost of capital is sending many buyers to the sidelines. Just 2.75 MSF of deals were inked in Q3, which is roughly half of the total for the same period last year.