Orange County 3Q 2025 Industrial Market Report
OVERVIEW

Q3 2025 continues the trend of softening demand and growing space availability across Orange County’s industrial market. Vacancy moved upward, driven by a combination of tenant consolidations and the delivery of new buildings, several of which came online without preleasing. Several sectors, including manufacturing, consumer products, home furnishings, and logistics, returned space as they adapted to changing business needs. The Federal Reserve’s recent interest rate reduction signals a new phase for monetary policy, though greater market confidence will require further rate adjustments. Ongoing trade tensions added pressure across many sectors. Net absorption remains negative, as more space returns to the market than is newly leased. Elevated sublease inventory persists, mainly from companies reducing their footprints. These factors have led to modest declines in asking rents.
VACANCY & AVAILABILITY
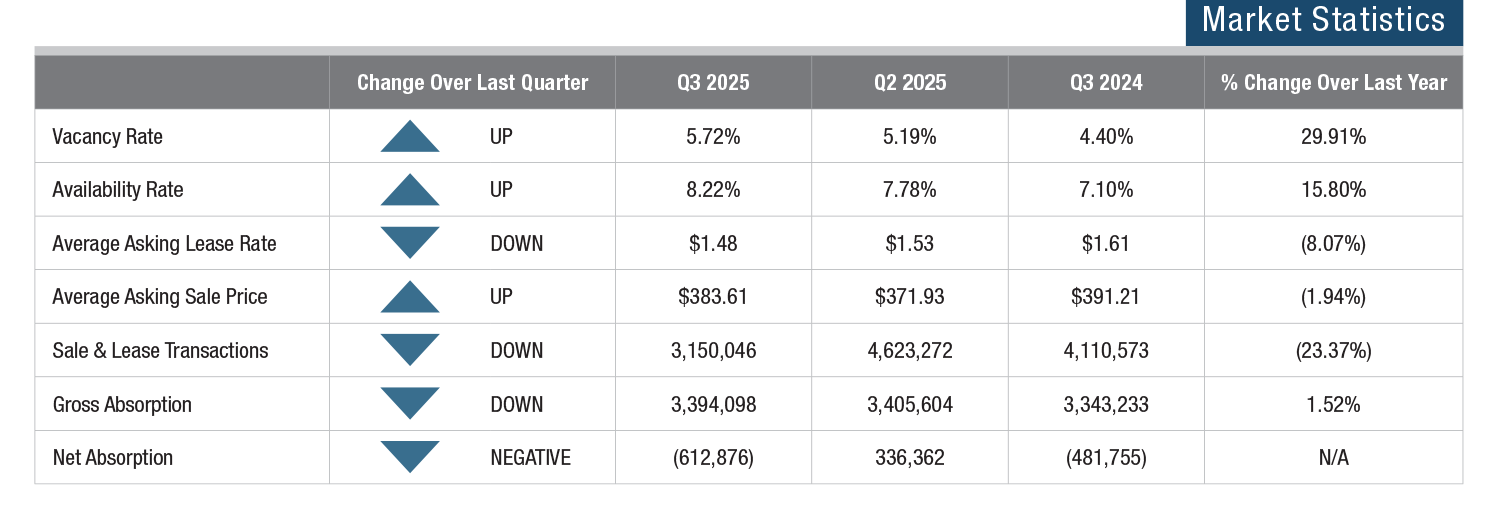
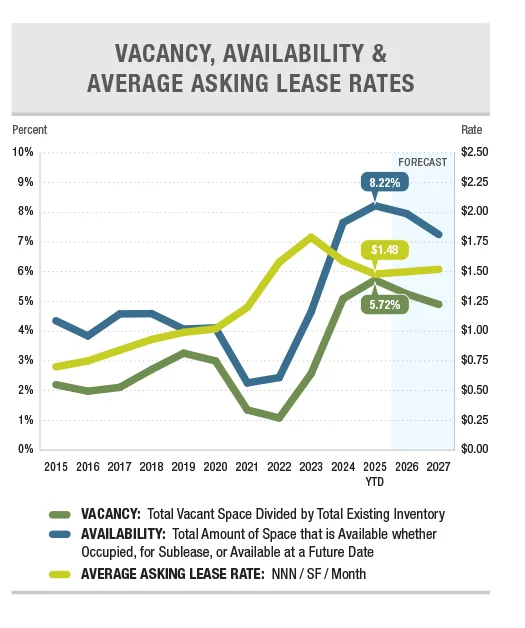
Orange County’s industrial vacancy rate rose to 5.72% in Q3 2025, up from 5.19% in Q2 2025 and 4.40% a year earlier, a 132-basis-point increase year over year. Available space reached 8.22% in Q3 2025, climbing 112 basis points from 7.10% in Q3 2024. The increase in vacant space has been driven primarily by larger, newly delivered properties and tenant moveouts from buildings exceeding 100,000 SF. Smaller buildings under 40,000 SF maintained tighter occupancy levels, sustained by steady demand from local businesses. Overall, properties remained on the market an average of 4.6 months before leasing.
LEASE RATES & SALES PRICES
Orange County’s average asking lease rate fell to $1.48 per square foot per month in Q3, down 8.07% year over year from $1.61. A surge of new industrial deliveries introduced competitive pricing, expanding tenant options and prompting landlords to adjust rates downward. Properties exceeding 50,000 SF are closing near $1.30 per square foot NNN, while spaces under 50,000 SF average $1.38. Smaller buildings below 40,000 SF maintain strong occupancy. The average asking sale price was $383.61 per square foot, down 1.94% from $391.21 a year ago. Limited inventory combined with elevated interest rates discouraged sellers from listing properties, though high replacement costs established a pricing floor that supported values notwithstanding lease rates having softened.
TRANSACTION ACTIVITY
Transaction activity declined in Q3 2025, totaling 373 combined lease and sale transactions, down from 406 in Q2. Overall square footage decreased to 3,150,046 SF from 4,623,272 last quarter. Leasing accounted for most of the activity, with 271 deals totaling 2,326,657 SF, compared with 282 deals and 2,925,938 SF in Q2. Sales activity included 51 transactions, covering 823,389 SF, down from 62 transactions and 1,697,334 SF last quarter. Lower lease rates are beginning to entice tenants who had been sitting on the sidelines, while anticipated Federal Reserve interest rate cuts could revive investor activity and accelerate investment decisions in the coming quarters. Owner-user purchases continue driving sales volume as businesses prioritize operational control, with user acquisitions reaching record levels and representing 25% of the year-to-date transaction volume.