Orange County 4Q 2022 Industrial Market Report
Overview
The Orange County industrial market is finally cooling off, but remains expensive and undersupplied. Vacancy hovered near its all-time low, gross and net absorption remained healthy and average asking lease rates moved even higher in 4Q. On the other hand, average asking sales prices fell sharply for the first time in a decade, while new sale and lease transaction activity fell by half. Construction remained thin. Quality space is still in short supply and OC business owners are still having trouble finding just the right space. Active requirements were on the decline for the second consecutive period and that loss in market velocity is just now starting to show up in the numbers. Mortgage interest rates doubled in 2022, and that has put a major dent in owner / user sale activity, a primary driver of Orange County’s industrial market. With lease rates still at all-time highs, business owners looking to lease are focusing on quality and bang for the buck, which has increased time-on-market for leased product.
Vacancy/Availability
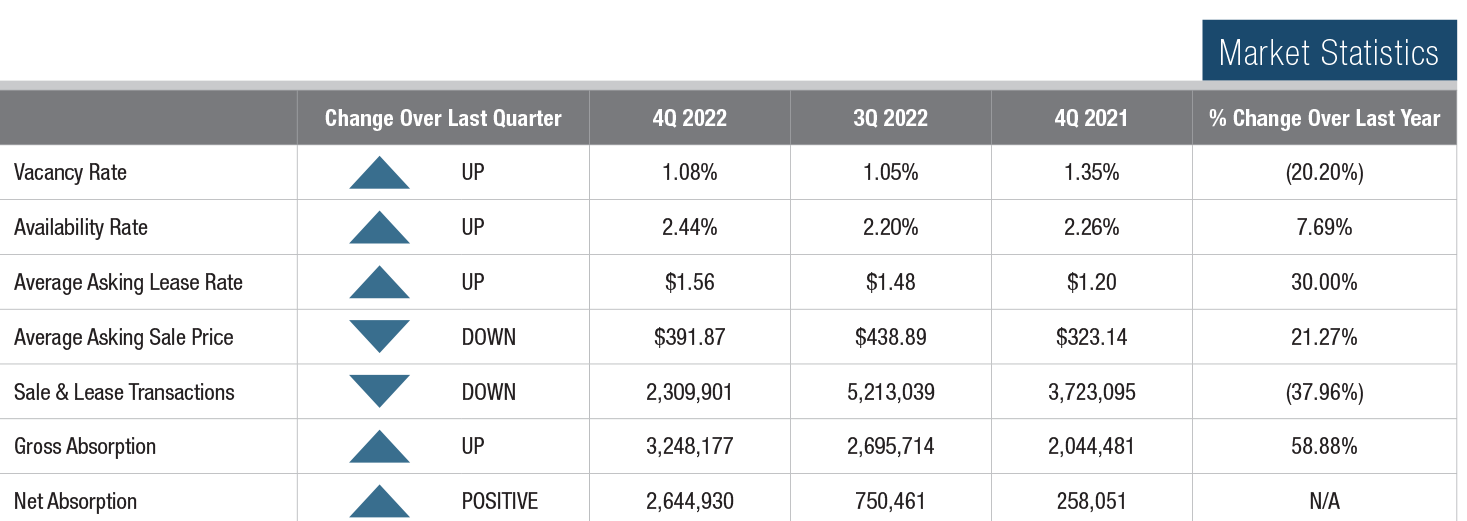
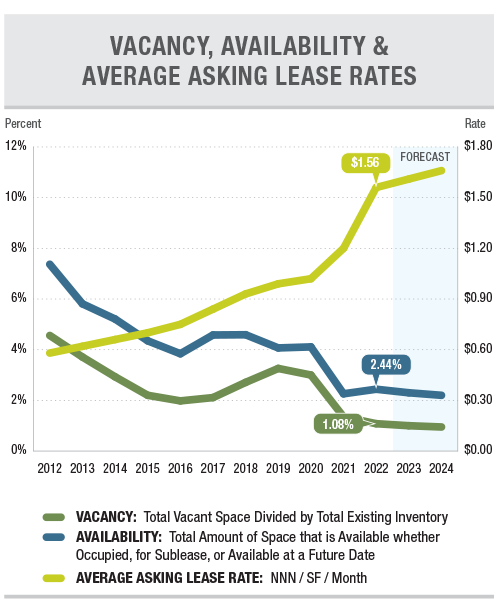
The overall vacancy rate in Orange County rose 3 basis points in 4Q to just 1.08%. Year-over-year, the vacancy rate is down by 27 basis points. Clearly, the shortage of good quality space is not over with despite the fact that the number of active requirements seems to be in decline. In fact, 17 Orange County cities we track still have a vacancy rate below 1%, so landlords maintain their advantage despite the shift in momentum. The availability rate, which includes space offered for lease or sale that is still occupied, held steady at 2.44% for the third consecutive period.
Lease Rates & Availability
The average asking lease rate for the county jumped another $0.08 to $1.56 in 4Q after a $0.15 increase in 3Q. Year-over-year, asking rents have increased by 30%, but, as we have been reporting, many buildings of high quality have been marketed and leased without an asking rate, so the actual average lease rate is even higher. Fixed annual rental increases remain in the 4.0% to 4.5% per year range, as landlords have become more focused on keeping up with inflation. The change in the county’s average asking sales price is the big news for 4Q. Overall, the per-square-foot asking sales price dropped by $47 in 4Q to a still-whopping $391.87. This is the first quarterly price decline since 2011. Price reductions are becoming commonplace and the bidding wars are all but over, as we see the result of the rising cost of capital and a change in market psychology.

Transaction Activity
As we have been reporting for years now, lease and sale activity has been restricted by a chronic shortage of quality available space. That shortage still exists, but demand is now on the wane, as buildings for sale or lease are sitting on the market for months rather than weeks or days. That shift is showing up in the transaction activity metric. In 4Q, the number of leasing transactions fell to 121 from 177 in 3Q. Sale transactions fell to 55 from 66 in the same period. Even more significant is the fact that the total square footage leased and sold fell from 5.2 MSF to 2.3 MSF in 4Q. Anecdotal input from agents in the field confirm that this now-measurable trend continues.