Orange County 4Q 2023 Industrial Market Report
OVERVIEW
 The Orange County industrial market stabilized in the final quarter of 2023. After climbing steadily since the middle of 2022, vacancy was unchanged in Q4. Net absorption was negative again during the period, but only slightly. New construction showed little change in Q4. Active lease requirements remained sparse, but supply stayed low enough to support lease rates and sales prices at levels near the recent market peak. In fact, both lease rates and sales prices moved higher again in Q4. High quality, functional buildings for lease and sale remain difficult to find, as tenants and buyers compete for the more modern properties. Owner / users sales, a primary component of industrial market activity for decades, remained hindered by higher mortgage rates.
VACANCY & AVAILABILITY
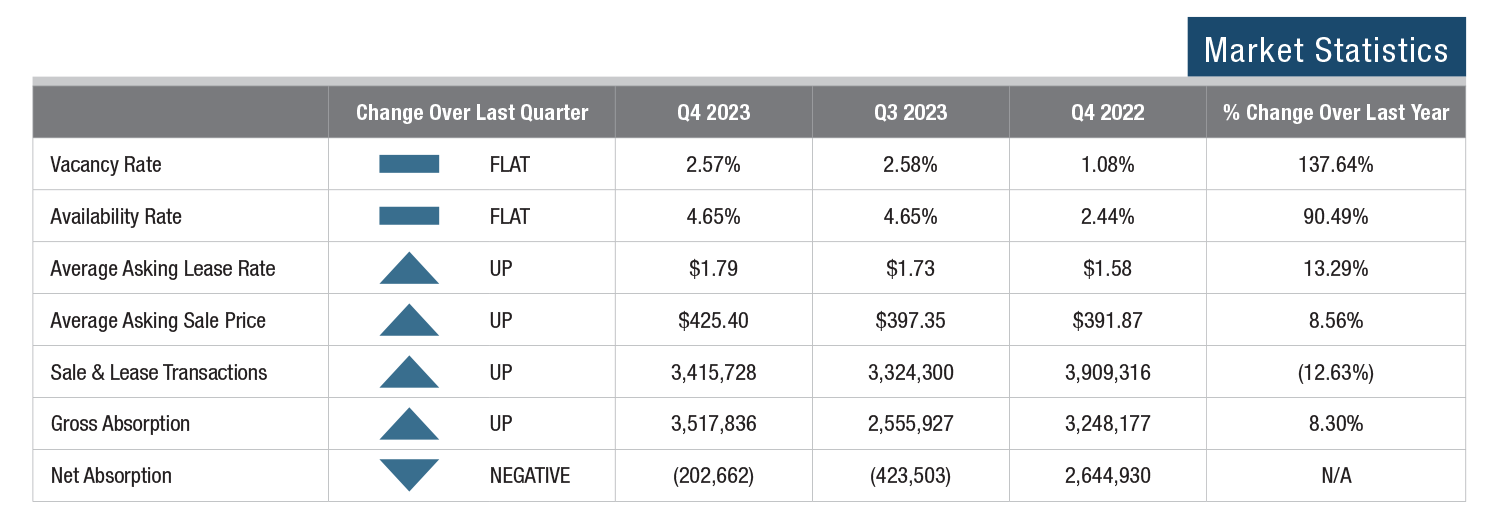
Orange County’s vacancy rate moved a single basis point lower to end the period at 2.57%, but year over year, vacancy is up 149 basis points from a historic low of 1.08%. The limited supply is fairly balanced with current tenant and buyer demand, which has a calming effect on the overall market after more than a decade of imbalance that sent sales prices and lease rates soaring. Tenants and buyers now have somewhat less competition, and they are not so disadvantaged in their negotiations with landlords and sellers. The availability rate, which includes currently occupied space offered for sale or lease, was unchanged during the period.
 LEASE RATES & SALES PRICES

The average asking lease rate countywide rose by $0.06 in Q4 to finish the period at $1.79, a new record high. Year over year, the county has seen a 13.3% increase in asking rents despite the moderation from functionally obsolete space. However, rent growth does appear to be cresting, as time-on-market is lengthening as tenants are showing more patience. After a price decline in Q3, the average asking sales price topped the $400 PSF barrier again in Q4, ending the quarter at $425.40 PSF. Transaction velocity has slowed due to the substantial rise in mortgage interest rates that began in March of 2022. Most sellers have refused to lower their prices to reflect the rise in borrowing costs, and other potential sellers have decided to wait for rates to come down before putting their properties on the market.
TRANSACTION ACTIVITY
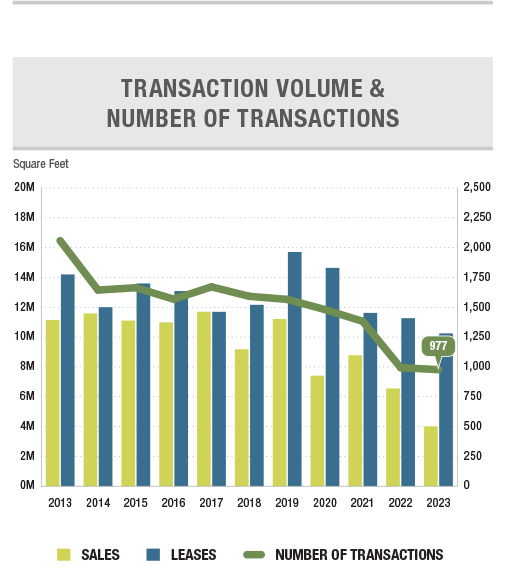
Overall lease and sale activity by square footage rose modestly in Q4, ending the quarter at 3.4 MSF, up from 3.32 MSF in Q3. However, this was a result of larger transactions, as the number of lease transactions fell from 216 to 140, and the number of sales decreased from 58 to 52. Sale activity by square footage rose to 1,537,000 SF from just over 909,000 SF in Q3. The biggest sale of the quarter was a 295,860 SF building in Buena Park, with total consideration of $71 million. The largest lease was a renewal for 218,640 SF to Exemplis, also in Buena Park.